

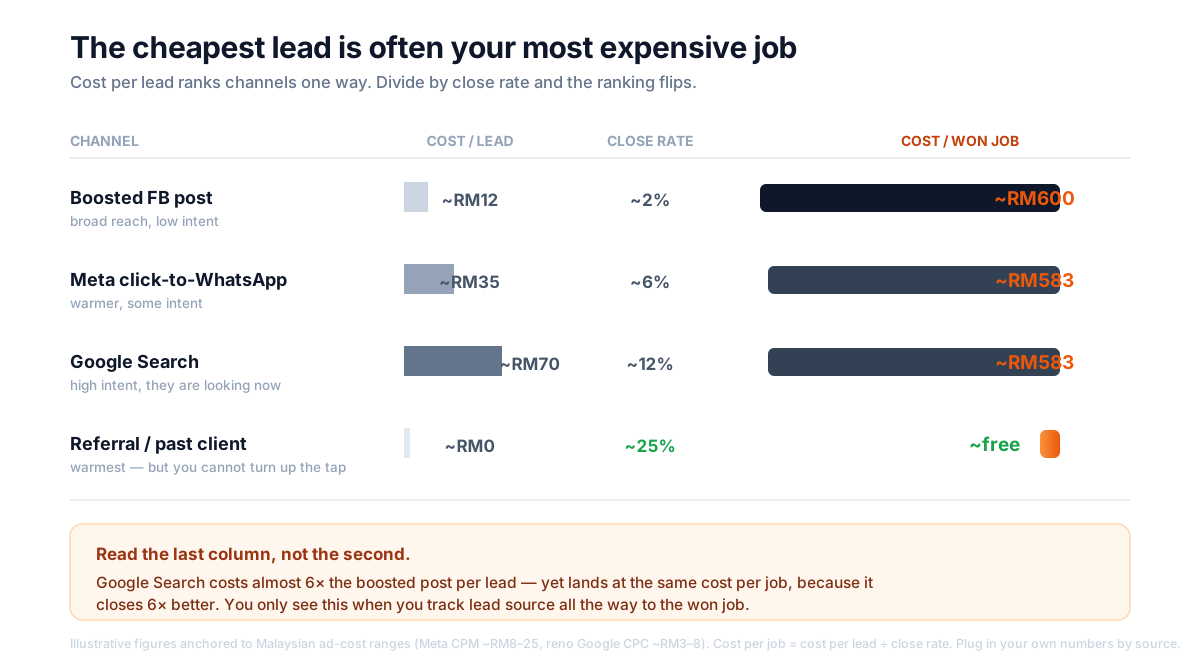
Here is a number that quietly misdirects most renovation marketing budgets: cost per lead. It's the figure every ad dashboard shows you, the one agencies quote, and the one owners instinctively try to push down. And it's the wrong number to optimise — because the cheapest lead is very often your most expensive job.
The metric that should decide where your ringgit goes is cost per won job — cost per lead divided by that channel's close rate. Since close rates vary roughly tenfold across channels, dividing by them reshuffles the ranking completely. A channel that looks expensive per lead can be your best value per deposit; a channel that looks cheap can be quietly the priciest thing you buy. Let's work it out with real Malaysian ad costs.
Why is cost per lead the wrong number to optimise?
Because it measures how cheap a channel is to feed, not how well it closes — and those are different things. Cost per lead rewards volume regardless of quality. A broad boosted Facebook post that reaches thousands of people who weren't looking for a renovation will happily produce enquiries at a low cost per lead. Most of them just aren't buyers.
The trap is that the metric looks like it's about efficiency. It isn't. It's about quantity of enquiries per ringgit — and enquiries don't pay you. Deposits do. When you optimise cost per lead, you systematically steer budget toward whatever channel produces the most enquiries cheaply, which is usually the lowest-intent channel on your list. You end up buying more of your worst leads because they're the cheapest to buy.
This is the same trap behind treating every enquiry as equally valuable. As we covered in what a lost renovation lead actually costs, a lead's worth is its expected value — job profit weighted by how often it converts. A channel's worth follows the same logic: it's not the price of the enquiry, it's the price of the job the enquiry eventually becomes.
What does cost per won job actually measure?
Cost per won job is the total spend on a channel divided by the number of paying jobs that channel produced — or equivalently, its cost per lead divided by its close rate. It's the honest price of a customer from that source.
Cost per won job = cost per lead ÷ close rate for that channel
That single division is where the ranking flips. Watch what happens across four channels a Malaysian reno or ID firm typically uses. These are illustrative figures anchored to real Malaysian ad-cost ranges — the point is the method and the direction, not the exact ringgit:
| Channel | Cost per lead | Close rate | Cost per won job |
|---|---|---|---|
| Boosted FB post (broad reach) | ~RM12 | ~2% | ~RM600 |
| Meta click-to-WhatsApp (some intent) | ~RM35 | ~6% | ~RM583 |
| Google Search (high intent) | ~RM70 | ~12% | ~RM583 |
| Referral / past client | ~RM0 | ~25% | ~free |
Read the last column, not the second. The boosted post has the lowest cost per lead and one of the highest costs per job. Google Search costs almost 6× more per lead — the number that makes owners flinch — yet lands at the same cost per job, because it closes six times better. And the referral, which costs nothing to "buy," is in a different universe entirely. If you ranked these channels by cost per lead you'd cut Google and pour money into boosted posts. Ranked by cost per job, that's exactly backwards.
What do renovation leads actually cost by channel in Malaysia?
Costs vary by channel and intent, but the Malaysian ranges are real and public. Here's what the current market looks like, so your own numbers have something to sit against.
- Meta (Facebook / Instagram) — cheap per lead, low intent by default. Across Malaysian Meta accounts, CPM runs roughly RM8–25 and CPC about RM0.50–3.00 (ZenWeb, 2025–2026). A broad boosted post can produce enquiries for RM10–40 each. Crucially, the format changes the intent: a click-to-WhatsApp ad — where the enquiry lands straight in your chat — pulls warmer, more serious enquiries than a boosted post or a website-traffic campaign, which is why it's become the default for Malaysian reno contractors.
- Google Search — pricier per lead, higher intent. Clicks on renovation and interior-design keywords like "renovation contractor KL" or "interior design Malaysia" run about RM3–8, with the most competitive KL terms pushing past RM10 (Listing.my; ZenWeb architect-firm data puts related CPCs at RM4.50–14.80 with a 6–11% landing-page conversion). After you account for the clicks that don't convert into an enquiry, a Google lead commonly lands around RM50–90. But these people typed their need into a search bar — they're looking now.
- Qanvast / Atap — "free" per lead, but shortlisted. Neither platform charges the homeowner, and Qanvast takes no commission from firms — its service is free and firms are matched to buyers, up to five recommendations per enquiry. So there's no per-lead fee, but you don't own the lead — you're one of several. The real cost isn't a fee; it's the winnable jobs you lose by being the slow one of the five.
- Referral — near-zero cost, highest intent. Word-of-mouth costs nothing to acquire and converts far better than any paid channel: people are around 4× more likely to buy when referred, and warm intros convert in the 15–25% band versus roughly 1% for cold paid social (Extole; channel benchmark data). The catch is in the SVG's fine print — you can't turn up the tap. Referrals scale with delivered jobs, not with budget.
Why does the ranking flip when you divide by close rate?
Because intent, not price, drives conversion — and intent varies far more than cost per lead does. A person who searched "renovation contractor near me" is deeper into a buying decision than someone who paused on a boosted post between reels. That intent gap shows up as a close-rate gap, and the close-rate gap is wider than the cost gap.
The maths is simple once you see it as a ratio. If Channel A costs 6× less per lead than Channel B but closes 6× worse, they cost the same per job — the two 6×'s cancel. If A costs 6× less but closes 10× worse, A is actually the more expensive channel per job despite the tempting lead price. Cost per lead only tells you one half of that ratio, and it's the half that flatters low-intent channels.
This is also why the enquiry-to-deposit conversion rate is one of the four numbers a reno firm must track, and why it has to be tracked per source. A single blended conversion rate — "we close about 8% of enquiries" — mathematically hides the exact spread that decides your budget. The average is the one number that guarantees you can't see the flip.
How do you actually work out cost per job for your firm?
You need three things per channel, and the third is where most firms fall down:
- Spend by channel. You already have this — it's on each ad platform, and referral/Qanvast spend is roughly zero.
- Leads by channel. Also usually available, though a shared WhatsApp inbox blurs it fast when three channels all land in the same chat.
- Won jobs by channel. This is the missing piece. It requires tagging every enquiry with where it came from at the moment it lands, and keeping that tag attached all the way through the funnel to won or lost. A lead that arrives untagged, or gets its source forgotten by the time it closes two months later, is invisible to this calculation.
The reason so few firms have cost-per-job numbers isn't the arithmetic — it's step 3. Malaysian home-service leads mostly arrive on WhatsApp, from a Qanvast handoff, a Google click, a boosted post, a referral, all funnelling into the same phone number. Without a system that stamps the source on arrival and carries it to the outcome, you're left with a spend report and a gut feeling. And a spreadsheet doesn't fix this reliably, because it only stays accurate if a busy salesperson religiously back-fills the source and the outcome for every lead — which collapses in exactly the busy months when the data matters most.
So the practical sequence is:
- Tag source on arrival, automatically. Not "I think that one was from Facebook" three weeks later.
- Carry the tag to the outcome. Won or lost, with the deposit value where you have it.
- Divide spend by won jobs, per channel. Now you have cost per job, and you can rank.
- Fund by cost per job, not cost per lead. Grow the channels that produce profitable jobs; fix or cut the ones that only produce cheap enquiries.
How HotLead fits in
HotLead is built so Malaysian renovation, interior-design and construction firms can see cost per job instead of guessing from cost per lead — on top of the WhatsApp you already use. It captures every enquiry with its source attached, so a Qanvast handoff, a click-to-WhatsApp ad and a referral don't blur into one anonymous inbox. It tracks each lead through the funnel to won or lost, so the source tag survives the two-month decision. And its funnel and per-channel ROI view shows enquiries, wins and drop-offs by source — which is exactly the per-channel conversion the cost-per-job calculation needs, and the number a blended average hides.
Start with the complete guide to managing renovation leads in Malaysia, see the renovation lead playbook, or go deeper on the four numbers every reno firm should track and where your renovation leads actually come from.
Sources: ZenWeb Malaysia Meta Ads pricing 2025–2026 (CPM ~RM8–25, CPC ~RM0.50–3.00; Meta CPL generally 30–60% cheaper than Google in Malaysia) and Google Ads CPC-by-industry data (architect/ID-adjacent CPC ~RM4.50–14.80, landing-page conversion 6–11%); Listing.my — Google Ads Cost in Malaysia (renovation/construction keywords ~RM3–8 per click, high-intent terms past RM10); WordStream Facebook Ads Benchmarks 2025 and US home-improvement CPL data (home-services CPL averaging ~USD 90 across channels; remodeling leads ~USD 80–180; Google home-improvement ~USD 25–110) for directional close-rate spread; Qanvast Malaysia (free service, no commission from firms, up to 5 recommendations under the Trust Programme, RM50,000 Qanvast Guarantee); Extole referral-marketing statistics and cross-channel conversion benchmarks (referred buyers ~4× more likely to purchase; warm intro/referral ~15–25% vs cold paid social ~1%). Ringgit and close-rate figures in the worked table are illustrative examples anchored to these ranges — replace them with your own spend, lead and won-job counts by source for your real cost per job.
Frequently asked questions
What is the difference between cost per lead and cost per job?
Cost per lead is what you pay to make one enquiry land — an ad spend divided by the number of enquiries it produced. Cost per won job is what you pay to close one paying customer — the same spend divided by the number of jobs that channel actually won. Because close rates differ enormously by channel, the two numbers rank your channels differently. Cost per lead tells you how cheap a channel is to feed; cost per job tells you how profitable it is. Only the second one should decide your budget.
How do you calculate cost per won job by channel?
Cost per won job equals that channel's cost per lead divided by its close rate for that channel. If Google Search leads cost you RM70 each and 12% of them become paid jobs, your cost per won job from Google is RM70 ÷ 0.12 ≈ RM583. Do it per channel, never blended, because a blended average hides which source is buying you jobs and which is just buying you enquiries. The only requirement is that you tag every lead with its source and follow it through to won or lost.
How much does a renovation lead cost in Malaysia?
It depends heavily on the channel. Meta (Facebook/Instagram) ad costs in Malaysia run roughly RM8–25 CPM and RM0.50–3.00 per click, so a broad boosted post can produce leads for RM10–40 each. Google Search clicks for renovation and interior-design keywords run about RM3–8 (higher, past RM10, for the most competitive KL terms), and after landing-page conversion a Google lead often lands in the RM50–90 range. Platform enquiries from Qanvast or Atap carry no per-lead fee but come pre-shortlisted against rivals. These are ranges, not quotes — your real figures depend on targeting, creative and location.
Why is the cheapest lead often the most expensive job?
Because cheap leads are usually low-intent. A broad boosted post reaches people who weren't actively looking, so it produces plenty of enquiries at a low cost per lead but a low close rate. When you divide a small cost per lead by a very small close rate, the cost per won job can end up higher than a channel whose leads cost several times more but close far better. The lead price flatters channels that are cheap to feed and punishes nothing — which is exactly why it's the wrong number to optimise.
Should a renovation firm stop spending on cheap lead channels?
Not automatically — measure first. A low-intent channel can still be worth running if its cost per won job is acceptable and it fills capacity your high-intent channels can't. The mistake is shifting budget toward a channel because its cost per lead is low, without checking whether those leads close. Rank every channel by cost per won job, fund the ones that produce profitable jobs, and cut or fix the ones that only produce cheap enquiries that never convert.
Keep reading
- The Only Three Ways to Grow a Renovation Firm — and Which Lever to Pull FirstEvery renovation firm's revenue comes down to three levers — how many leads you get, how many you close, and how big each job is. They multiply, so a modest lift on each compounds. But they cost wildly different amounts to pull, and most owners reach first for the one they should reach for last. Here's the ranking, with Malaysian numbers.
- Sight Unseen: Winning the Overseas Malaysian Who Renovates a Unit They Can't VisitA Malaysian working in Singapore collects the keys to a KL condo and messages you to fit it out — but they can't come to a site visit, can't walk your showroom, and will wire a deposit to a firm they've never met. Most firms treat this lead like a walk-in, go quiet when the buyer can't pop by, and lose the highest-budget job in the inbox. Here's why the remote buyer is your hardest-trust but best-paying lead, and how to build a remote lane that actually closes it.
- "Ok, Proceed" Isn't Money in the Bank — I Built an AI to Ask for the Deposit the Moment a Renovation Buyer Says YesA Cheras contractor closes a RM62k job on WhatsApp, the buyer says "ok proceed lah", and then the owner — mid-site, phone in a dusty hand — has to stop, pull the bank details, the agreed deposit and the scope, and type a careful money message. In that gap a hot yes quietly cools back to "let me think." The 2026 reflex is to ask AI to detect the yes and auto-fire the invoice. I built it, and it asked a half-committed buyer for 40% to a personal account two seconds after a soft "ok ok". Here's the version that kills the typing delay without asking for money off a misread.