

An owner I've been trading notes with all year finally got his house in order. He'd wired up a proper lead system — every WhatsApp enquiry captured, one owner per lead, a funnel view, per-channel numbers, a scoreboard showing who replies fast. Six months earlier he was flying blind. Now he had the whole dashboard.
And he told me, a bit sheepishly, that he opens it on Sunday night, looks at it for a while, and thinks: okay... now what? The numbers are all there. What to do with them isn't.
That's the report step — the last link in the lead chain, the one that's supposed to turn all the captured data into a decision. And it's the one where the most data quietly dies. So he asked the very 2026 question: "Can't I just point AI at all this and have it write me a weekly report that tells me what to fix?" I built exactly that, ran it for a month, and killed it. Here's why — and the boring version that actually changed something.
What is the report step actually for?
Not to describe what happened — to decide what you change next. The report step exists to turn a pile of captured lead data into one or two decisions an owner acts on this week. Everything else it produces is decoration. And decoration is where it usually fails.
Here's the uncomfortable backdrop: somewhere between 80% and 90% of the data a business collects never gets used for a decision — "dark data," as Gartner and Splunk call it. In a survey of over 1,300 decision-makers, most said at least half their data sits dark. A reno firm's lead dashboard is a perfect little example: it captures everything and changes nothing, because nobody has the time or the framework to turn "close rate 8%" into "do this on Monday."
So the temptation is obvious. If the gap is reading the numbers and deciding, and AI reads well, just let AI write the report. That's the reflex. Let me show you why it backfires.
Why does asking AI to "write my weekly report" fail?
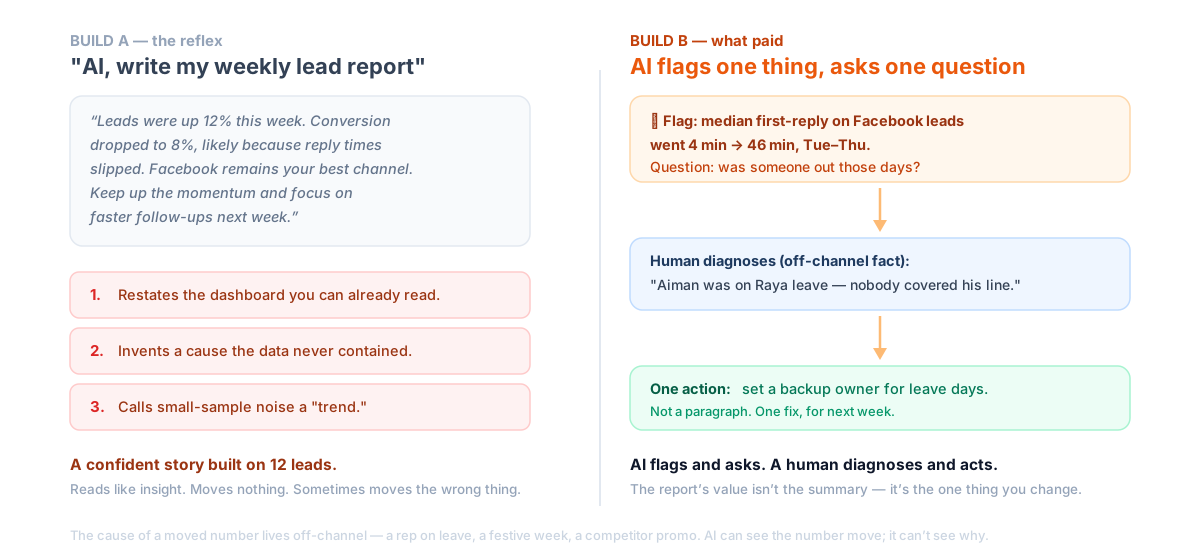
Because it fails three ways at once, and all three are invisible until you check the AI's work against reality. I fed a model a month of real lead data — leads by source, reply times, funnel stages, wins and losses per week — and asked it for a weekly performance summary an owner could act on. It gave me clean, confident paragraphs like this:
"Leads were up 12% this week. Conversion dropped to 8%, likely because reply times slipped. Facebook remains your best channel. Keep the momentum and focus on faster follow-ups next week."
Reads great. It's also close to useless, for three separate reasons.
1. It restates the dashboard you can already read. "Leads up 12%, Facebook is your best channel" — you can see that in one glance at the funnel. Re-narrating a chart in full sentences isn't insight; it's the same number wearing a tie. Zero added value, just more words to read.
2. It invents a cause it has no way of knowing. "Conversion dropped because reply times slipped." Did it? The model saw two numbers move in the same week and wrote a story connecting them. It has no idea whether that's true — the real reason could be a rep on leave, three junk enquiries from one boosted post, or nothing at all. This is exactly how AI hallucinations happen in analytics: a language model's actual job is to produce plausible text, so it fills the unknown with a confident-sounding guess and polishes it until it reads like a finding. It's the same failure I mapped across the whole pipeline in what AI still can't do — the deciding fact lives off-channel, so AI guesses and states the guess as fact.
3. It calls random noise a trend. This is the one that will genuinely cost you money, and it's worth its own section.
Why is a small firm's weekly number almost always noise?
Because it's built on a handful of events, and a handful of events bounces around on pure chance. This is the un-Googleable bit, so let's do the actual Malaysian math instead of hand-waving.
A busy small reno or ID firm might get 40 to 60 enquiries a month and close around 7 to 8% of them — call it three to five jobs a month, or roughly one win a week. So your "weekly close rate" is really one win versus zero versus two, out of about a dozen leads. That's 8%, then 0%, then 17% — a chart that looks like a heart attack but is just coin-flips.
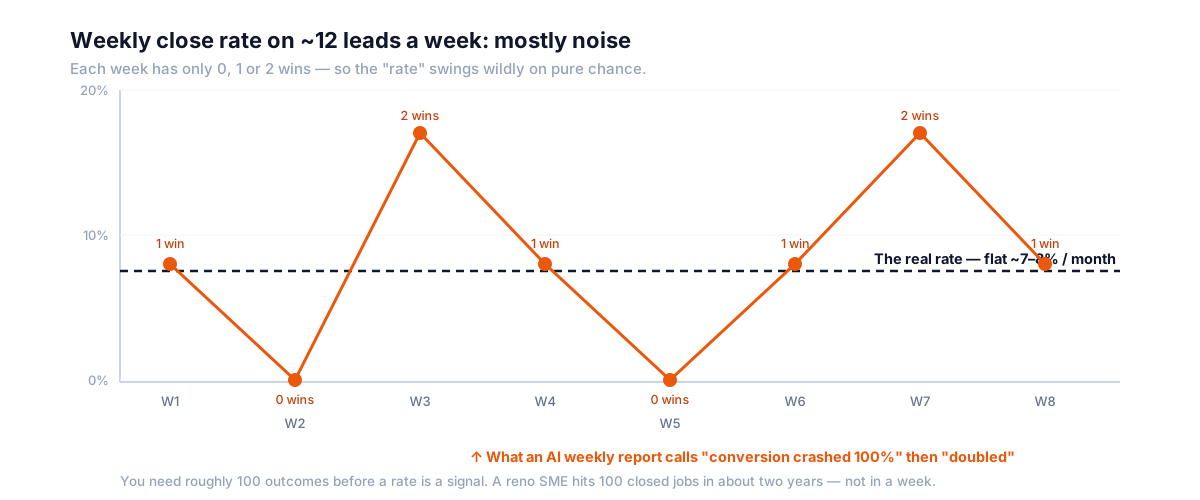
The statistics people have a rule of thumb for this: you want somewhere around 100 conversions before a rate is trustworthy, and you can't read a cycle-based metric on less than a full cycle (analytics-toolkit, HubSpot). A firm closing four jobs a month takes about two years to reach 100 wins. So a weekly close rate isn't a slightly-rough signal — it's overwhelmingly noise, and an AI narrating it week to week will hand you a dramatic "conversion crashed 30%!" almost every single week, because something always looks like it moved.
So what did the version that actually paid look like?
The opposite job. Instead of summarise everything and conclude, the build that earned its keep does one thing: watch a few load-bearing numbers against a threshold, flag when one crosses the line, and ask a question — full stop. No narrative, no cause, no conclusion.
- It watches operational numbers you control, not outcome numbers — median first-reply time, the count of leads sitting with no owner, quotes untouched past a set number of days. These have enough events every week to be real.
- Each gets a plain threshold. Reply time over 15 minutes. Any lead unowned for an hour. A quote silent past your normal follow-up window.
- When one trips, AI surfaces one flag and one question: "Median reply time on Facebook leads went from 4 to 46 minutes, Tuesday to Thursday — was someone out?"
- A human answers from the context AI can't see — "Aiman was on Raya leave and nobody covered his line" — and turns it into one action: set a backup owner for leave days.
That's it. AI does the part it's genuinely good at — noticing the one number among twenty that moved, instantly, for a fraction of a sen. The human does the part AI can't — knowing why, and deciding what to do. It's the same division of labour that worked at the assign step and the CRM-update step: let AI read, keep the judgment human.
Which numbers should you read weekly, and which monthly?
This is the practical payoff, and almost nobody splits it correctly. The mistake baked into every "real-time dashboard" and AI weekly report is reading everything at the same cadence. But your numbers come in two very different kinds, and they earn attention on completely different clocks.
| Number | Type | Read it | Why this cadence |
|---|---|---|---|
| Median first-reply time | Operational (you control) | Weekly | Every lead is an event, so it's real within a week; and it's a leading indicator you can fix now |
| Leads with no owner | Operational | Weekly / daily | Binary and countable — one unowned lead is one too many, no sample-size problem |
| Quotes aging past your follow-up window | Operational | Weekly | Actionable immediately; a stalled quote is the most valuable lead in the building |
| Close rate | Outcome (lagging) | Monthly / quarterly | Tiny weekly sample — needs ~100 outcomes to stabilise |
| Cost per won job by channel | Outcome | Monthly / quarterly | Cost per job needs volume before the ranking is trustworthy |
| Weighted pipeline value | Outcome | Monthly | Swings on one or two big jobs; read it slowly |
The logic is simple once you see it. Operational numbers — reply speed, unowned leads, aging quotes — have an event for every lead, so they're trustworthy weekly and they're the things you can actually change on Monday. Outcome numbers — close rate, cost per job, pipeline value — are built on wins, which are rare, so they're noisy weekly and only tell the truth over a month or a quarter. Read the fast, controllable stuff often; read the slow, lucky stuff slowly. An AI weekly report blends them into one paragraph and treats a two-year signal like a weekly one — which is precisely the noise trap.
What should an owner actually do on Monday?
Keep the reporting boring and human, and spend AI on the narrow job it's good at. The whole point is to end the week with one decision, not a wall of narrated numbers.
- Don't buy the "AI writes your business report" feature. A narrated dashboard is a vanity feature. It restates what you can see and manufactures causes it can't know — the two things you least need.
- Pick three operational numbers and read them weekly — median reply time, unowned leads, aging quotes. These are your steering wheel; they have enough events to trust and you can act on them now.
- Read outcome numbers monthly, not weekly. Close rate, cost per job, pipeline value. If you must look weekly, look at the count (three wins, two wins) and resist the urge to read a "rate."
- Use AI to flag and ask, never to conclude. Set thresholds, let it surface the one number that moved and a question. You supply the cause from what you know off-channel; you pick the one fix.
- End every review with one action. Not five. The report worked if you changed one thing — a backup owner for leave days, a follow-up on the three quotes gone quiet, a pause on the channel bleeding cash.
How HotLead fits — and why there's no AI narrator
I'll be straight, because over-claiming is the exact hype I keep arguing against. HotLead gives you the reporting a human reads and acts on — and deliberately doesn't wrap it in an AI-written story.
- A funnel view that shows where leads leak, stage by stage, so you can see the drop that's costing you.
- A per-channel view so you can see cost and return by source — Facebook versus Qanvast versus referral — and read it on the right, slower clock.
- A team-performance view so you can see who's fast and who's sitting on quotes — an operational number, safe to read weekly.
- A next action and an overdue nudge on every lead, so the report doesn't just describe the leak — it points at the specific lead to chase today.
There's no bot writing you a Sunday-night essay, and that restraint is the point. A small firm's weekly numbers are too noisy to narrate safely, and the cause of any real move lives in your head, not the data — so HotLead surfaces the numbers cleanly and leaves the judgment where it belongs, with you. If leaking leads are the problem underneath all this, start with the complete guide to managing renovation leads in Malaysia, see how it fits a renovation firm or an interior design studio, or read the companion builds on what AI still can't do and auto-updating the CRM.
Sources: The "dark data" figure — that roughly 80–90% of the data organisations collect goes unused, with most decision-makers reporting at least half their data is dark — from Splunk's dark-data research and the Gartner definition it cites. Sample-size and statistical-significance rules of thumb (around 100 conversions before a rate is reliable; you can't read a cycle-based metric on less than a full cycle; small samples produce noise, not signal) from Analytics-Toolkit and HubSpot's A/B testing sample-size guidance. The mechanism behind AI inventing causes in analytics — that language models optimise for plausible text, not truth, and "polish" a guess into a confident finding — from insightsoftware on AI hallucinations in analytics and SAS on AI hallucinations. Malaysian AI-adoption split (27% of businesses use AI; 73% only for basic tasks) from AWS, consistent with the figure used across this series. Renovation lead-volume, close-rate and expected-value figures (40–60 enquiries a month, ~7–8% conversion, ~one win a week) are typical operating numbers reused from the funnel-benchmarks and cost-of-lost-lead pieces, labelled as typical, not a single quoted study. The illustrative per-lead AI cost and the weekly-report experiment are described from practice and labelled illustrative, not a quoted price or a controlled trial.
Frequently asked questions
Can AI write a weekly sales or lead report for my renovation firm?
It can produce a fluent one, and that's the danger. When I ran it for a month it did three unhelpful things at once — it restated numbers I could already see on the dashboard, it invented causes it had no way of knowing (blaming a conversion dip on "slower replies" when the real reason was a rep on leave), and it treated the random week-to-week bounce of a small firm's numbers as a meaningful trend. A confident paragraph built on twelve leads reads like insight but moves nothing, and sometimes moves the wrong thing. The useful version has AI flag one anomaly and ask a question, not narrate a story.
Why is a small firm's weekly close rate so unreliable?
Because it's built on almost no wins. A busy small reno or ID firm might get 40 to 60 enquiries a month and close around 7 to 8% of them, which is roughly three to five jobs a month, or about one a week. So a single week is one win versus zero versus two — close rates of 8%, 0% and 17% that look like a dramatic swing but are pure chance. As a rule of thumb you need around 100 outcomes before a rate is a signal rather than noise, and a firm this size takes about two years to reach 100 closed jobs. Read outcome numbers monthly or quarterly; weekly, they mostly lie.
What should AI actually do at the reporting step, then?
Watch, flag and ask — not summarise and conclude. Point it at a few load-bearing operational numbers you control, like median first-reply time, the count of leads with no owner, and quotes sitting untouched past a set number of days. Give it a threshold for each. When one crosses the line, it surfaces one flag and one question — "median reply time on Facebook leads went from 4 to 46 minutes on Tuesday to Thursday, was someone out?" A human answers using the context AI can't see, and turns it into one fix. AI is good at spotting the number that moved; it's bad at knowing why, because the why is almost never in the data.
Why can't AI tell me why a number moved?
Because the cause lives off-channel, the same reason it can't make other judgment calls in your pipeline. When your Facebook conversion dips, the real reason is a fact that isn't in the report — a salesperson was on Raya leave, a competitor ran a promo that week, three of the enquiries were tyre-kickers from one boosted post, or the festive lull hit. AI sees two numbers move together and, because a language model's job is to produce plausible text, it manufactures a causal story to connect them. That's how AI hallucinations happen in analytics — the model polishes a guess until it reads like a finding. A wrong cause stated with confidence is worse than an honest "this moved, go look."
Does HotLead generate an AI report of my leads?
No, and that's deliberate. HotLead gives you the real reporting a human reads and acts on — a funnel view that shows where leads leak, a per-channel view so you can see cost and return by source, and a team-performance view so you can see who's fast and who's sitting on quotes. It doesn't wrap those numbers in an AI-written narrative, because a small firm's weekly numbers are too noisy to narrate safely and the cause of any real move lives in your head, not the data. The tool surfaces the numbers clearly and keeps a next-action and overdue nudge on each lead; you supply the judgment. That's the honest split.
Keep reading
- The Only Three Ways to Grow a Renovation Firm — and Which Lever to Pull FirstEvery renovation firm's revenue comes down to three levers — how many leads you get, how many you close, and how big each job is. They multiply, so a modest lift on each compounds. But they cost wildly different amounts to pull, and most owners reach first for the one they should reach for last. Here's the ranking, with Malaysian numbers.
- Sight Unseen: Winning the Overseas Malaysian Who Renovates a Unit They Can't VisitA Malaysian working in Singapore collects the keys to a KL condo and messages you to fit it out — but they can't come to a site visit, can't walk your showroom, and will wire a deposit to a firm they've never met. Most firms treat this lead like a walk-in, go quiet when the buyer can't pop by, and lose the highest-budget job in the inbox. Here's why the remote buyer is your hardest-trust but best-paying lead, and how to build a remote lane that actually closes it.
- "Ok, Proceed" Isn't Money in the Bank — I Built an AI to Ask for the Deposit the Moment a Renovation Buyer Says YesA Cheras contractor closes a RM62k job on WhatsApp, the buyer says "ok proceed lah", and then the owner — mid-site, phone in a dusty hand — has to stop, pull the bank details, the agreed deposit and the scope, and type a careful money message. In that gap a hot yes quietly cools back to "let me think." The 2026 reflex is to ask AI to detect the yes and auto-fire the invoice. I built it, and it asked a half-committed buyer for 40% to a personal account two seconds after a soft "ok ok". Here's the version that kills the typing delay without asking for money off a misread.